There are many underground mining software tools available to plan and schedule the development of underground mines. A shortfall of these tools is the optimization of the underground equipment and strategy in order to maximise the development rate. This paper will
illustrate how the SimMine® software was used to maximise underground development at Petra Diamonds’ Cullinan Diamond Mine. It will also determine the effect of various development strategies and equipment capacities on the underground development rate and pinpoint potential bottlenecks in the mine development cycle.
Introduction
Cullinan Diamond Mine (CDM) is in the process of planning the access and infrastructure development as part of the planned expansion. The current expansion plan will total approximately 23,000 meters and will be developed in a phased approach. The project will start
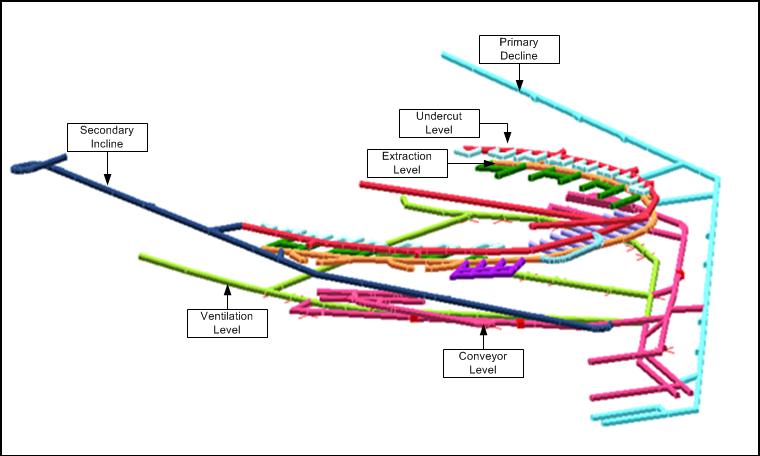
with the development of a decline from the existing 763 Level to the bottom of the planned deepened Number One Rock Shaft. The decline will also enable access to the extraction, undercut and conveyor levels below 830 Level.
As part of the rapid underground development optimisation study CDM opted to utilise the flexible and user-friendly SimMine® software to assist in reducing construction time by selecting and managing the number of trackless equipment. This will shorten the critical path development during the early stages of the planning process.
A further objective of the study is to test various scenarios in order to determine the optimal scenario that maximises the underground development rate, which in turn will maximise mine revenue and earlier ROI.
SimMine was selected over other simulation software tools for the following reasons:
- Tailor-made and designed for underground mine development modelling
- Ability to directly import mine layouts
- Fast model input parameter definition
- Comprehensive model output statistics as standard
- Utilised by best practise mining companies
The disadvantage of the software is the limited ability to incorporate complex ore handling systems. However, the waste handling capacity was not a constraint in this study. The layout of the planned development is shown in Figure 1. The decline will be approximately 880 m long, with muck bays located at 60 m intervals.
The approach followed in this study is summarised below.
The SimMine model simulates real-life underground development incorporates all the equipment
performance data, operational shift times and other relevant input variables. By analysing the
simulation results, bottlenecks and constraints are identified. The Inputs can be optimised to
align the planning to the mine development strategy.
The SimMine software holds numerous advantages over deterministic analysis (e.g. spreadsheets)
- Simulates the integrated process with interdependent elements,
- Captures tramming interference of all equipment,
- Captures loading interference of multiple trucks/loaders,
- Determines actual re-muck tonnage,
- Captures real effect of random equipment downtimes on advance rate,
- More accurate tramming times based on actual dynamic distances,
- Utilise statistical distributions to model variations in process times,
- Quick “What-if?” analysis
Development Cycle
The conceptual simulation model’s battery limit is waste development. The waste rock has a density of 2.67 t/m³ and the advance per round is 3.0 m. An availability of 85% was assumed for all the equipment and a shift utilisation of 83%.
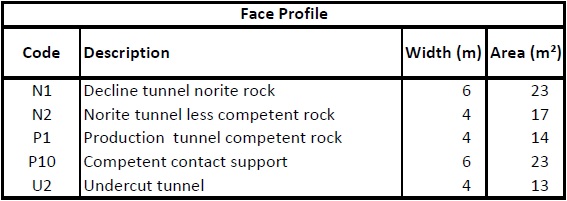
The face profiles for the development sections are shown in Table 1.
The activity cycle for the development includes
- Face preparation
- Drilling
- Charging
- Blasting
- Loading and transport
- Watering down and making safe
- Applying Sealant
- Shotcreting
- Bolting
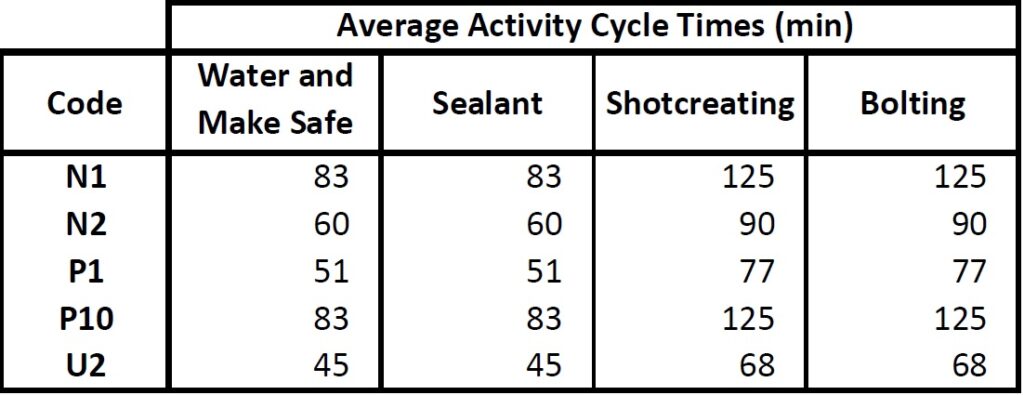
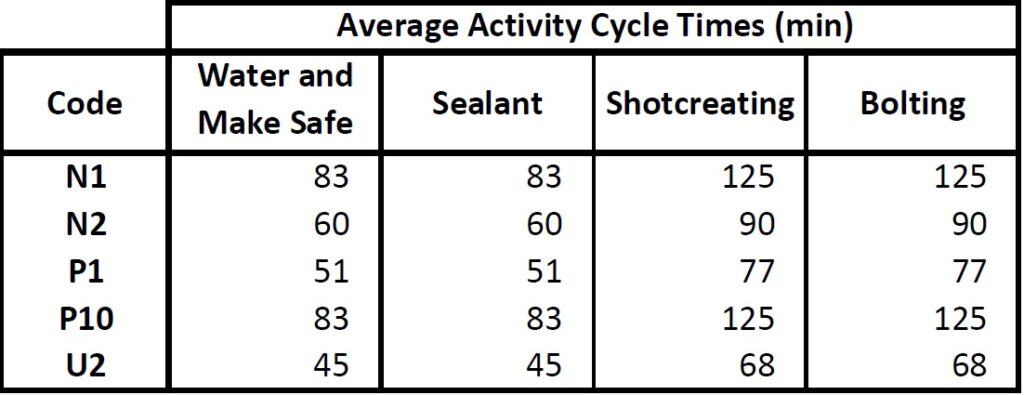
A triangular distribution is used to sample the cycle time per activity. The average activity times within the development cycle are shown in Table 2 and Table 3.
The decline will be equipped with a moveable conveyor, following approximately 100 m behind the development face. Blasted rock is loaded to the closest muck bay, from where it is mucked to the conveyor. The loader properties are described in Table 4.

Scenario Analysis
In rapid underground development the Mine optimal development strategy has to be determined.
Common development strategies
- Maximum development meters,
- Lowest cost
- Optimal scale of operations (Equipment / operator optimisation)
There are many input variables that have an effect on the mine’s potential development rate. In order to test all the combinations of input variables will result in an impractically high number of scenarios that will have to be analysed. The scenarios were reduced and corroborated with the mine to include:
- Multi-blasting
- Additional development equipment
- Alternative crew shift schedules
Scenario Results
The base case scenario is run with all the original planned variables and parameters. In the conceptual base case scenario a total of 11,663 m is developed over a period of 1,742 days.
Figure 2-shows the meters developed against the average amount of headers available per month. This describes to the ability of the equipment respond to an increase in the number of available development faces.
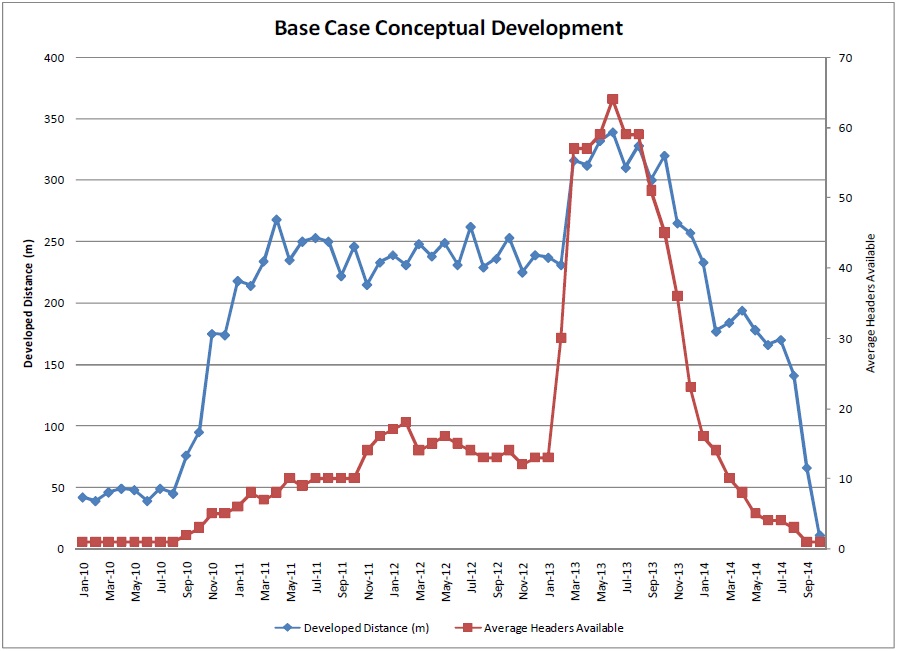
Figure 3 shows the activity per equipment. The main equipment categories include the average:
- Work time
- Idle time
- Meals and Shift breaks
- Down Time
On the secondary axis the travel and traffic time per equipment is defined.
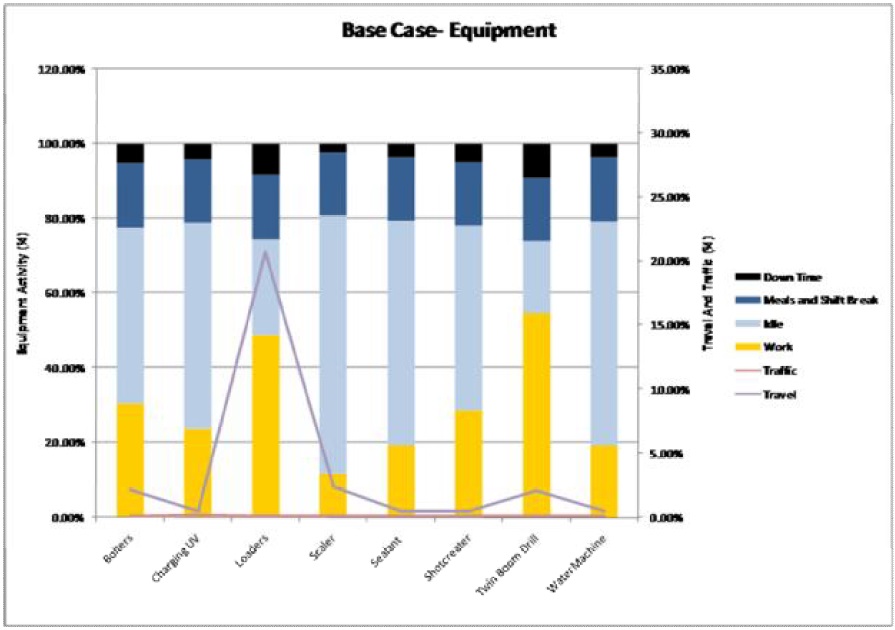
Figure 3 indicates that the highest utilised equipment is the twin boom drill rig and the loader. Figure 4 shows the utilisation of the twin boom drill rig and Figure 5 shows the activity on the loader for the duration of the mine development.

As shown in Figure 4, the drill rig is utilised to its maximum level from May 2011 to Oct 2013. Figure 5 shows a very high loader utilisation in the period Aug 2012 to Mar 2014.
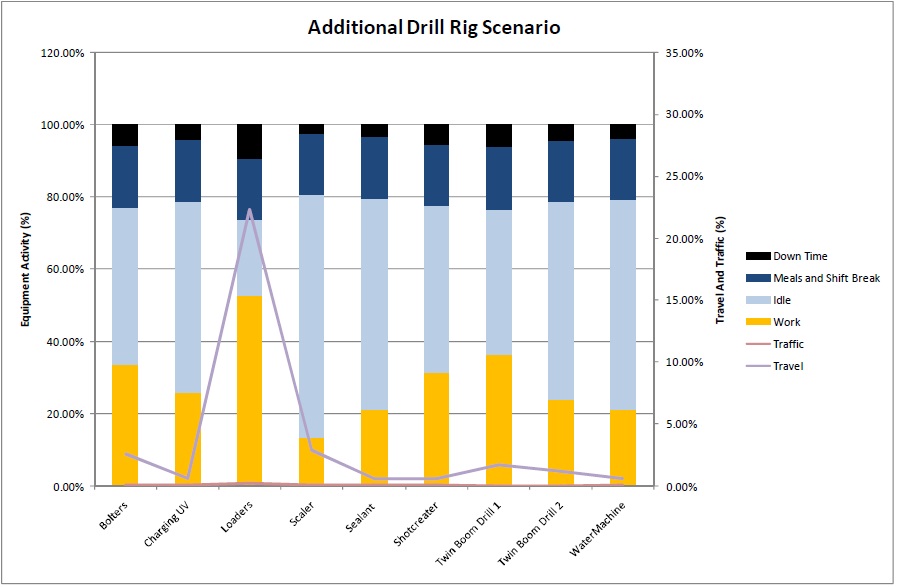
A first alternative scenario is set up by adding an additional drill rig to view the operational effect on the conceptual base case.
Figure 6 indicates that by adding an additional drill rig the average drill rig utilization decreases
and the average utilization of the remaining of the development equipment increases.

In the first alternative scenario the conceptual 11,663 meters development period can be reduced from 1,742 to 1,705 days. Figure 7 shows that the drill rig is no longer the constraint.
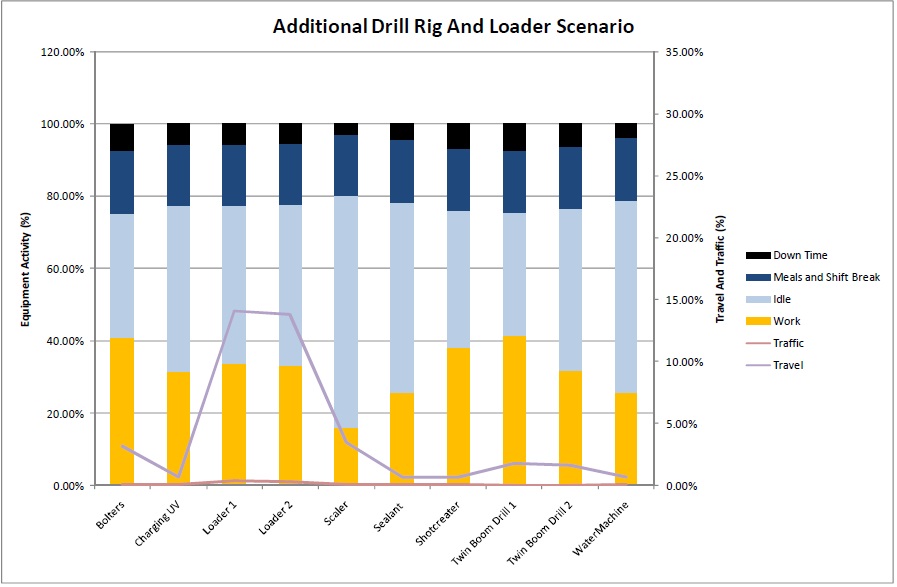
The high loader utilisation (see Figure 5) indicates that the loader is also a constraint in the activity cycle. Figure 8 shows the utilisation results when an additional loader, together with addition to the extra drill rig is added to the simulation.

In this scenario the equipment utilisation is more balanced, with no obvious constraints.
The conceptual development of the 11,663 meters can reduced scenario from 1,705 to 1,308 days. Upon completion of the conceptual design it is planned to use SimMine’s cost capability to analyse the financial implications of each scenarios.
Instead of increasing the equipment, other scenarios were identified, including:
- Multi-blast
- Longer daily shifts (from two ten hour to two twelve hour shifts per day)
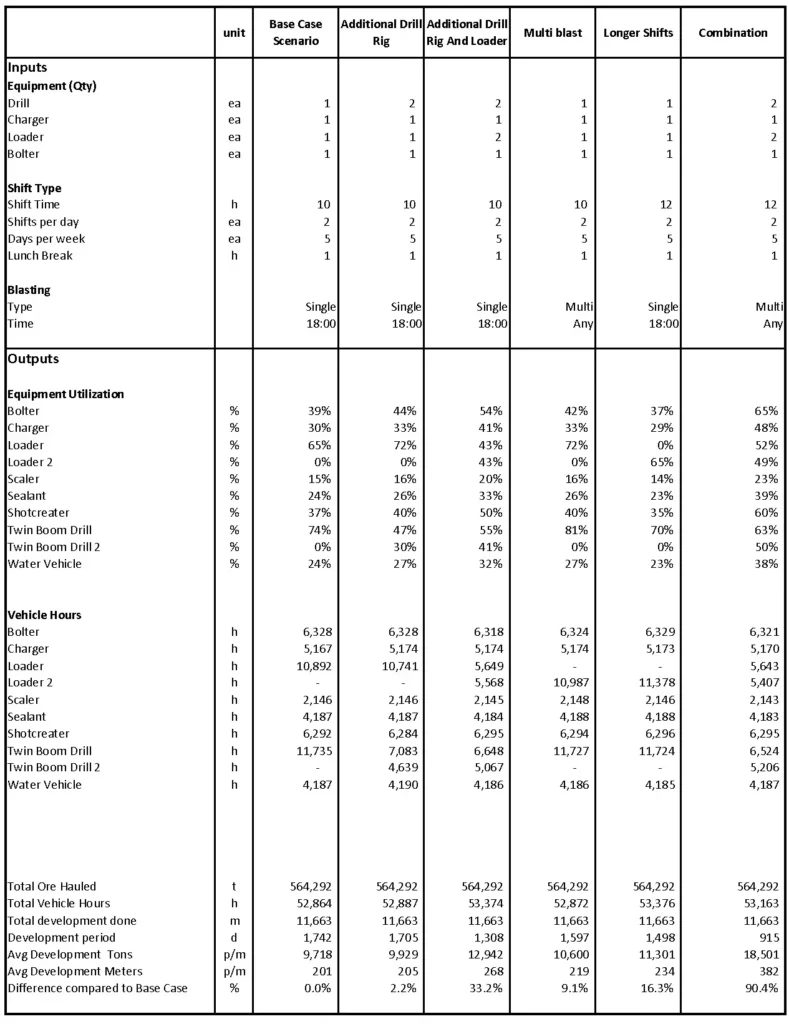
One can also easily combine the scenarios to view the conceptual effect on the operations. Table 5 summarizes the results of the scenarios. The combined scenario results include the additional drill rig and loader, a multi-blast strategy and two twelve hour shifts.
Conclusions
The objective of the study was to use an effective and flexible tool to quickly analyse the effect of different scenarios on the achievable development rate. The SimMine software proved to be very effective to simulate the scenarios and provide comprehensive and detailed equipment performance results.
The software also has the capability to incorporate development costs, including vehicle costs (investment, operational, electrical, fuel, tires and maintenance), operator costs (hourly rates and shift allowances) and material cost (material cost per section per hour) to analyse the total cost, the Net Present Value on equipment and the return on Investment. Once the conceptual design is approved, Petra Diamonds will incorporate all the costs into the simulation model.
The base case simulation results indicate that the bottleneck in the development cycle is the drilling (74% utilisation) and loading (65% utilisation) activities that an improvement of 33 % can be expected by adding an additional drill rig and loader to the fleet.
The multi-blast scenario results indicate a potential increase of 8 % in the development rate and increasing the operating shift from 10 hours to 12 hours resulted in an increase of 16%. A combination of all the scenarios showed the highest increase in development rate of 90 %, translating in a reduction of almost 28 months of development.
The model results have to be aligned with the mine’s strategic development rate and input costs to select the optimal scenario. If the objective is to maximise the development rate, it is recommended that the scenarios analysed in this study are implemented.
References
C Musingwini C., Minnitt R.C.A. & Woodhall M, Technical operating flexibility in the analysis of mine layouts and schedules, The Journal of the South African Institute Of Mining and Metallurgy, Vol 107, pp 129-136
Smith, G. L., Pearson- Taylor J. Anderson D.C. & Marsh A.M, Project valuation, capital investment and strategic alignment-tools and techniques at Anglo Platinum, Second International latinum Conference ‘Platinum surges Ahead’, The South African Institute of Mining and
Metallurgy.
Acknowledgements
The authors of the paper wish to sincerely thank Petra Diamonds’ Cullinan Diamond Mine personnel Teon Swanepoel, Cor Baltus, Ben Swarts and Erhard Grobler for their inputs and time into this project and for the permission to publish this paper.
